Metrics Monitoring
A monitoring platform ingests time series, stores recent and historical samples, serves queries, and evaluates alerts.
Interview scope and guarantees
Ingest labeled numeric samples, query time ranges, aggregate dashboards and evaluate alert rules. Define acceptable data loss, lateness and query freshness. The number of unique label combinations is a first-class capacity constraint.
Capacity worksheet
Assume 100,000 targets each expose 1,000 series every 15 seconds: 100 million active series and about 6.67 million samples/s. At an illustrative 2 compressed bytes/sample, values alone consume about 1.15 TB/day; labels, indexes, WAL and replication add more. A user_id label can multiply this dramatically.
Concrete API contract
POST /write {series:[{labels,samples}]}
GET /query_range?query=...&start=...&end=...&step=...
POST /rules {expression,forDuration,labels}
GET /alerts
Data model and access paths
series(series_id PK,fingerprint,tenant_id,metric_name,canonical_labels); UNIQUE(tenant_id,metric_name,canonical_labels)
samples(series_id,timestamp,value); PK(series_id,timestamp)
blocks(tenant_id,min_time,max_time,object_key,index_key,checksum)
alert_state(rule_id,rule_version,label_set,pending_since,state,last_transition_id,last_sample_watermark)
Evolve a solution and explain each change
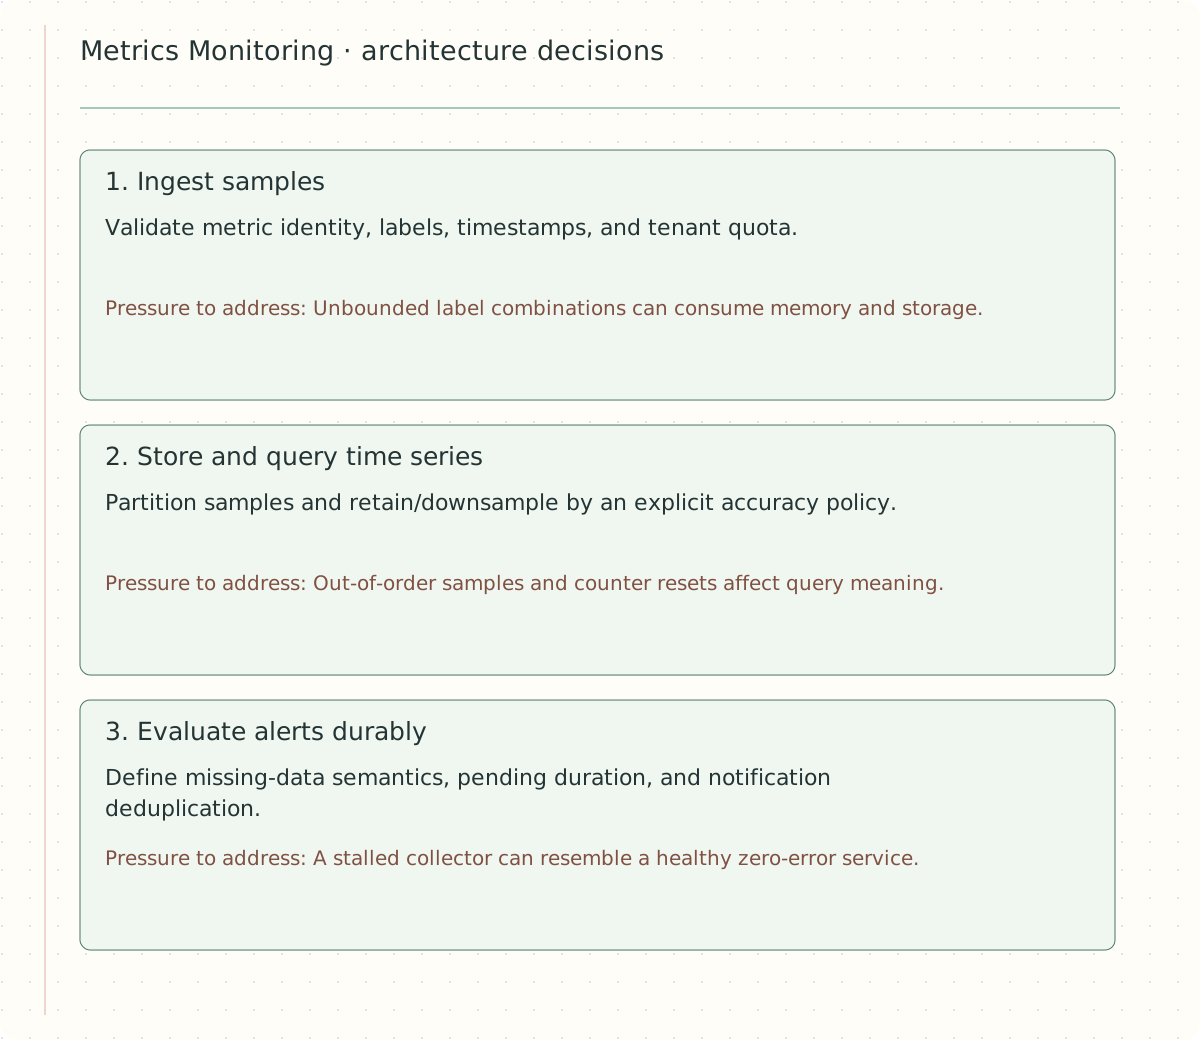
Figure — Three architecture decisions for Metrics Monitoring, including the pressure each introduces.
Step 1: Ingest samples
Validate metric identity, labels, timestamps, and tenant quota. Unbounded label combinations can consume memory and storage.
Step 2: Store and query time series
Partition samples and retain/downsample by an explicit accuracy policy. Out-of-order samples and counter resets affect query meaning.
Step 3: Evaluate alerts durably
Define missing-data semantics, pending duration, and notification deduplication. A stalled collector can resemble a healthy zero-error service.
Responsibility overview
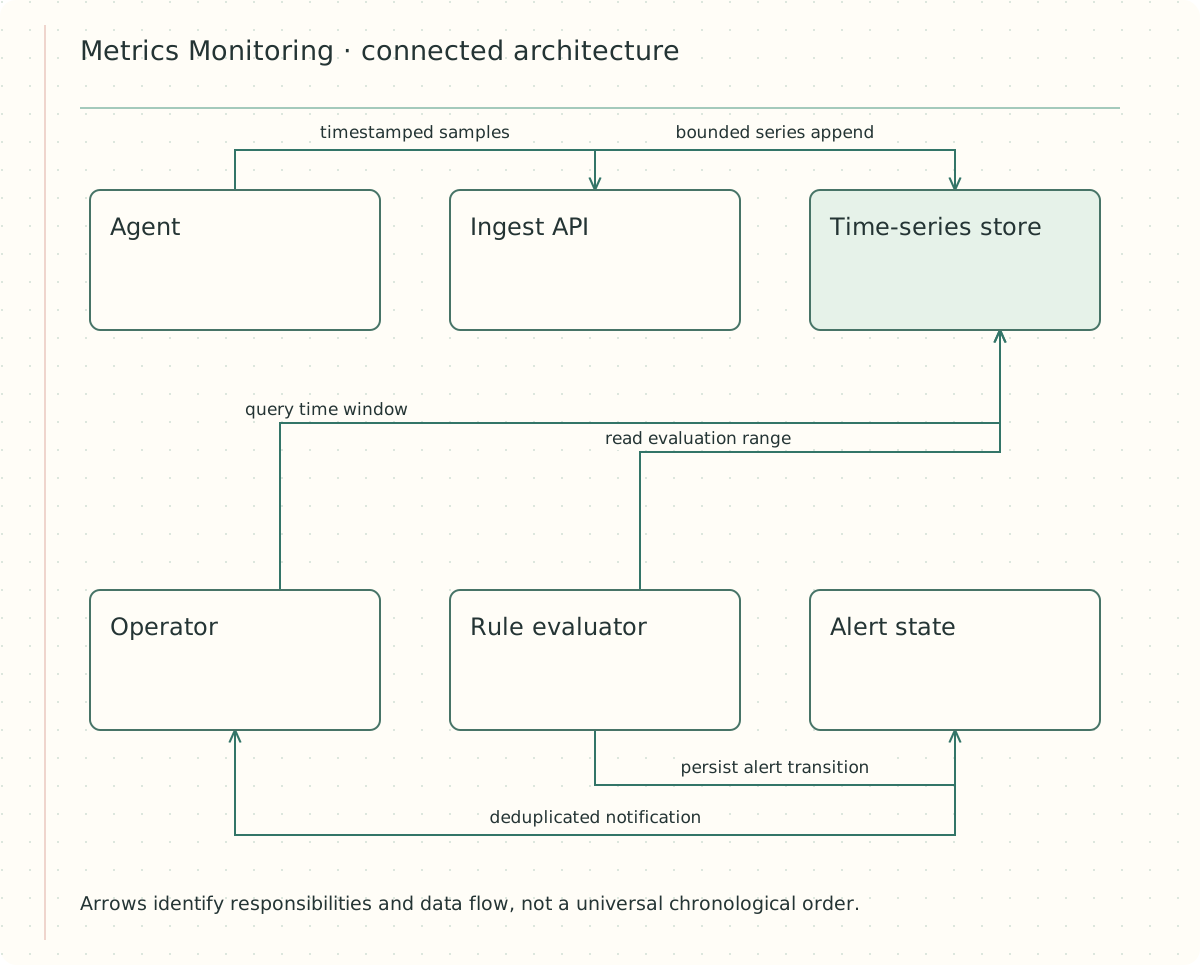
Figure — Connected responsibilities for Metrics Monitoring. Trace the authoritative and derived paths separately.
Worked end-to-end scenario
A service exposes request_count as a monotonically increasing counter, then restarts and the value returns to zero. The query engine must calculate reset-aware rates rather than reporting negative traffic. An error-rate alert evaluates a window and stays pending for a configured duration before firing. If ingestion stops, absence is not automatically zero errors: show no-data and apply a stated missing-data policy. A tenant includes request IDs as labels, creating millions of series. Reject or constrain the high-cardinality dimension before it exhausts the storage and query fleet.
Why these access paths matter
Metric identity is name plus a canonical label set scoped to tenant. Partition samples by series and time; maintain a label index for queries. Retention and downsampling change the resolution available for historical windows. Alert instances are keyed by rule and label set, with evaluation state and a stable notification transition identity.
Build the baseline first
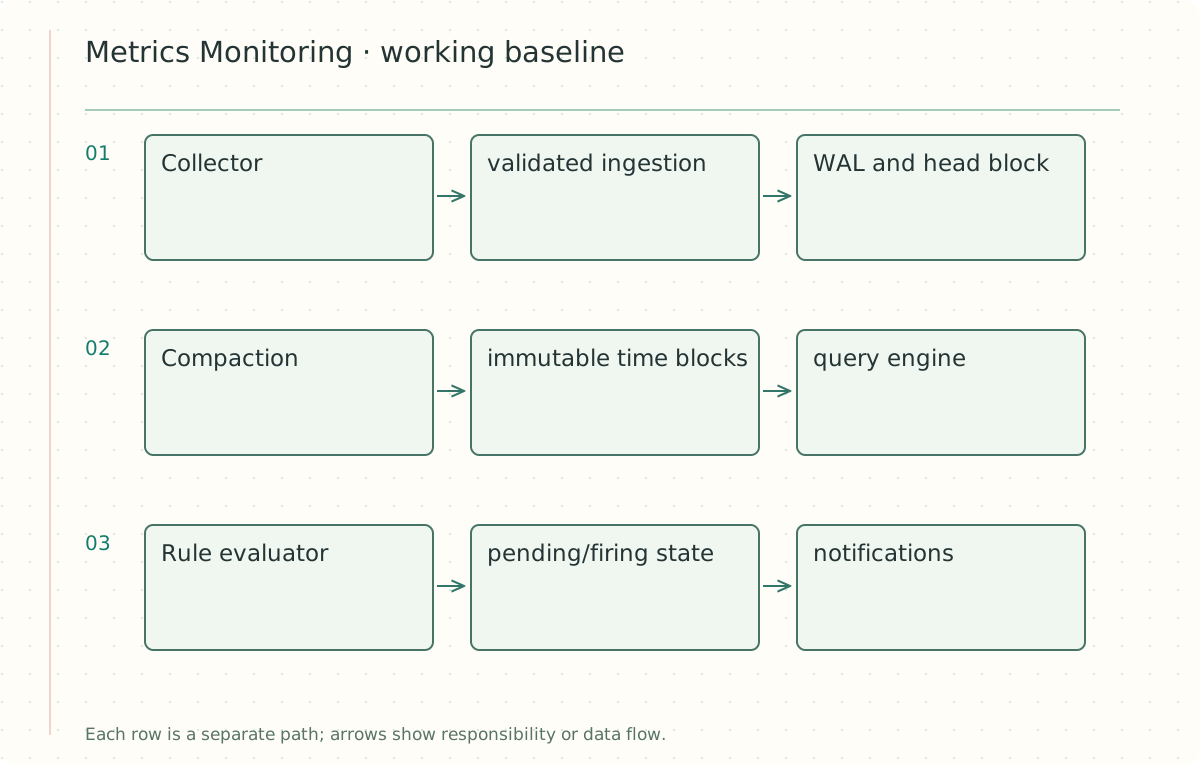
- Collector → validated ingestion → WAL and head block.
- Compaction → immutable time blocks → query engine.
- Rule evaluator → pending/firing state → notifications.
Evolve the design under load
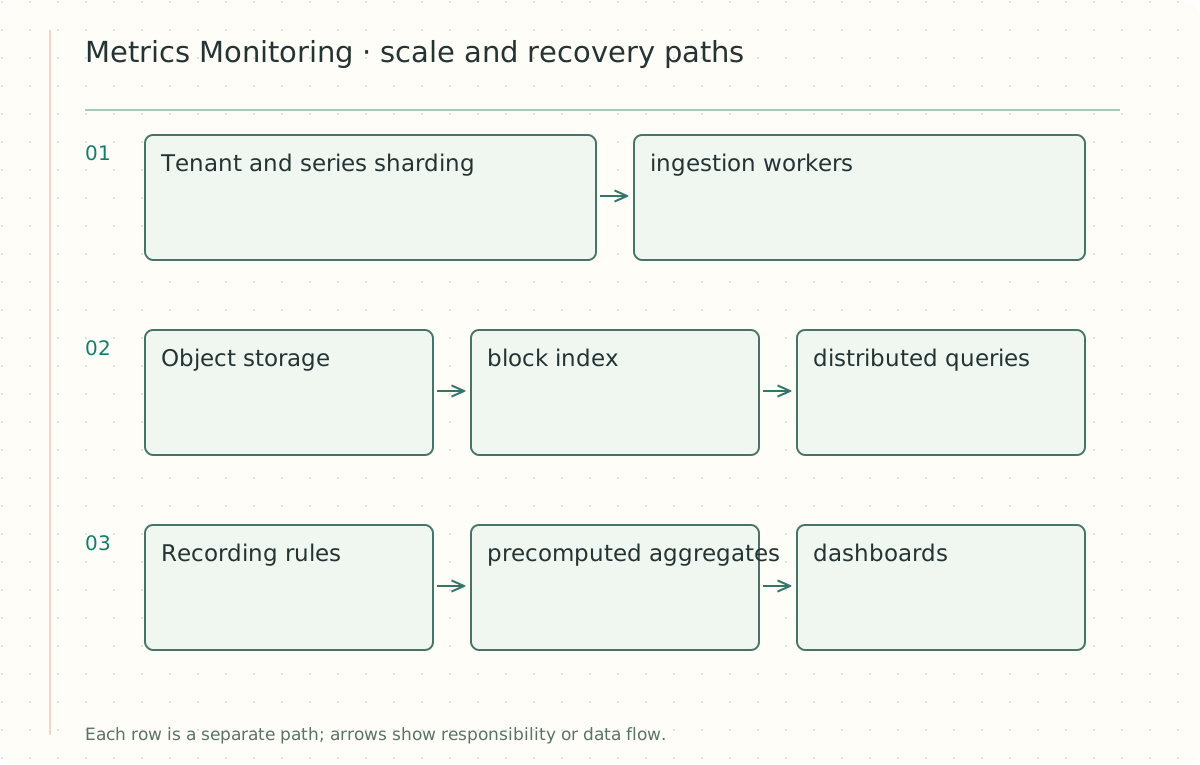
- Tenant and series sharding → ingestion workers.
- Object storage → block index → distributed queries.
- Recording rules → precomputed aggregates → dashboards.
Defend the hardest decision
Counters accumulate and can reset; gauges represent current values. Rates must account for counter resets and sampling intervals. Histograms permit aggregation across instances if bucket definitions match; averaging precomputed percentiles is generally invalid. Query cost depends on series cardinality and time range, so enforce per-tenant limits and bounded fanout.
Failure and recovery analysis
An ingestion replica fails after acknowledging a sample. The durability contract determines whether another replica or a persisted log can recover it. Alert evaluators need stable identities so failover does not create duplicate notifications. Missing data is not automatically zero; an absent target may require a separate availability alert.
Security and privacy boundary
Isolate tenant reads and writes, avoid personal information in labels, and cap expensive queries.
Interview follow-ups with reasoning
Question: How do you control cardinality?
Show answer and explanation
Answer: Reject or relabel unbounded dimensions and report dropped-series counts.
Question: How do you handle delayed samples?
Show answer and explanation
Answer: Define an out-of-order acceptance window and query semantics.
Question: How do you test alerts?
Show answer and explanation
Answer: Replay known incident traces including missing data and counter resets.
Operate and verify the design
Active series, rejected labels, sample lag, query cost and alert evaluation delay.
Introduce high-cardinality labels and verify one tenant cannot exhaust ingestion for all others.
A second scenario to test transfer
A service exports 100 metrics across 20 instances and 5 status classes: an illustrative 10,000 combinations before other labels. Adding a label with a million user values can multiply this dramatically. The exact count depends on which combinations exist, but the direction is clear. Put per-request detail in logs or traces with their own budgets rather than exploding metric labels.
Why is averaging the p99 latency from ten instances not the service-wide p99?
Show answer and explanation
Answer: Percentiles are not generally composable by averaging. Instances can have different volumes and distributions. Aggregate compatible histogram counts or underlying observations and compute the percentile from that combined distribution.
Compare alternatives
| Concern | Design response | Signal |
|---|---|---|
| Cardinality | Bound labels and tenant budgets | Active series count |
| Query cost | Range and concurrency limits | Scanned series and latency |
| No data | Explicit stale policy | Last sample age |
| Alert noise | Pending duration and grouping | Actionable alert rate |
A design-changing exercise
No samples arrived for ten minutes. Does that prove there were no errors?
Show answer and explanation
Answer: No. Missing telemetry is distinct from observed zero errors and needs its own health and alert policy.
Design workshop: store series, then query and alert
Core scope is labeled samples, range queries, dashboards and alerting. Logs/traces are separate products. Choose a 15-second scrape interval, one-minute alert evaluation and an explicit late-sample window. Tenant isolation and no-data behavior are core correctness requirements; millions of unconstrained request IDs as labels are not acceptable.
A series identity is tenant + metric name + canonical sorted label set. A fingerprint locates candidates, but compare full labels to resolve hash collisions; do not silently merge two series. Store a stable series_id mapping, index postings for label/value→series IDs, append samples to a WAL and in-memory head, then compact into immutable time blocks with chunk/index metadata. Query workers select label postings, read matching chunks by time range and merge reset-aware series results. Object-store blocks require a catalog/read path, not just an ingestion database box.
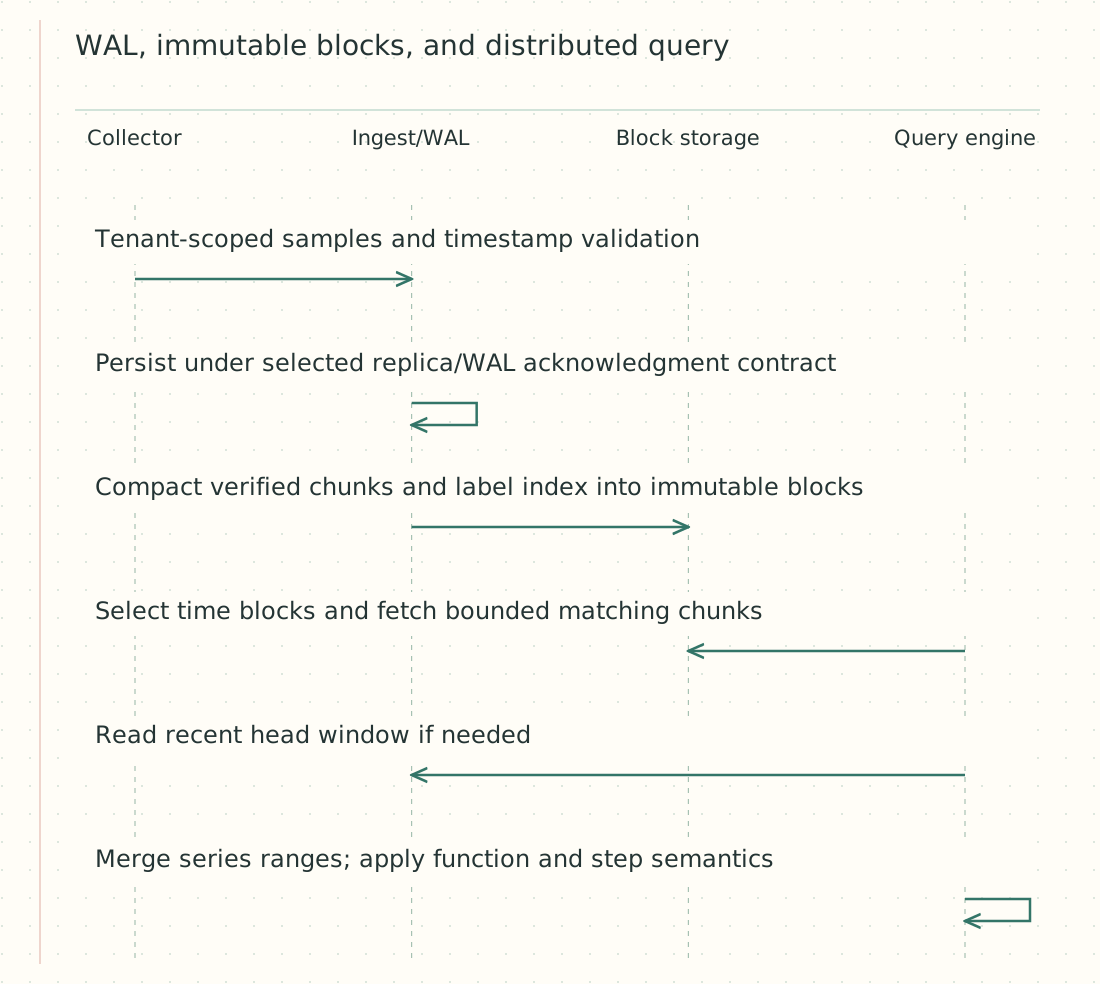
Figure — WAL, immutable blocks, and distributed query.
Pull scraping exposes target health independently; a failed scrape is not a numeric zero. Push ingestion supports short-lived jobs but requires lifecycle/expiry policy so old pushed values do not look permanently healthy. A collector outage marks staleness after the selected threshold. Rate queries detect counter resets; a negative delta after restart is not negative request traffic. Out-of-order samples inside the accepted window use a documented duplicate-timestamp policy; older data is rejected/reprocessed under an explicit path.
At 6.67 million samples/s and an illustrative two bytes/value, values alone are about 1.15 TB/day and 17.28 TB over 15 days. Labels, WAL, chunks, indexes, replicas and fragmentation add more. One-minute rollups from 15-second samples reduce point count about 4×, but preserve sum/count for averages, extrema for ranges and bucket counts for histograms. A downsampled average cannot reconstruct a spike or exact p99.
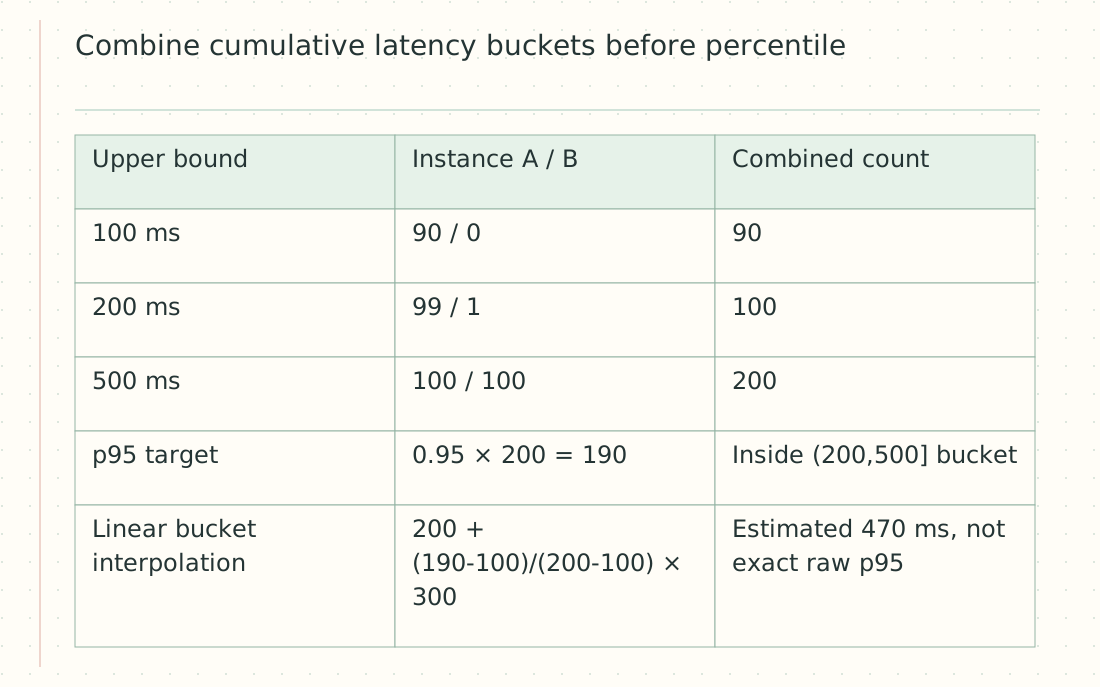
Figure — Combine cumulative latency buckets before percentile.
The histogram example intentionally estimates within buckets; it does not claim observations were uniform. Compatible bucket boundaries permit count aggregation. Precomputed instance p95/p99 values cannot be averaged into a service percentile, particularly with unequal volumes. A query names aggregation dimensions and compatible units explicitly.
Alert instance key is rule_version+label_set. For expression true with for=120s and 60-second evaluations: true at t=0→pending, t=60→pending, t=120→firing. False clears pending/resolves firing; no-data follows a separate chosen policy, for example unknown plus a target-absent alert rather than healthy. Store pending_since and firing transition ID durably so evaluator failover does not restart the timer or resend the same transition. Notification grouping/silence is separate from evaluating truth.
Two evaluators require fenced shard ownership or a deduplicated transition transaction. Record last evaluated sample watermark; a delayed old evaluation cannot resolve a newer alert. Limit range duration, scanned series, query concurrency and per-tenant active series. Monitor WAL lag, cardinality rejection, query scanned bytes, no-data age and alert transition delay separately.
Exercise: Instance A has 100 requests mostly below 100 ms; B has 100 mostly near 500 ms. Is the average of their p95 values a valid combined p95?
Show answer and explanation
Answer: No. Aggregate compatible bucket counts and estimate from the combined distribution, as above, or use the raw observations. The linear estimate reflects bucket granularity and must be presented as such.
Prometheus storage and histogram practices document primary storage/query concepts used here.